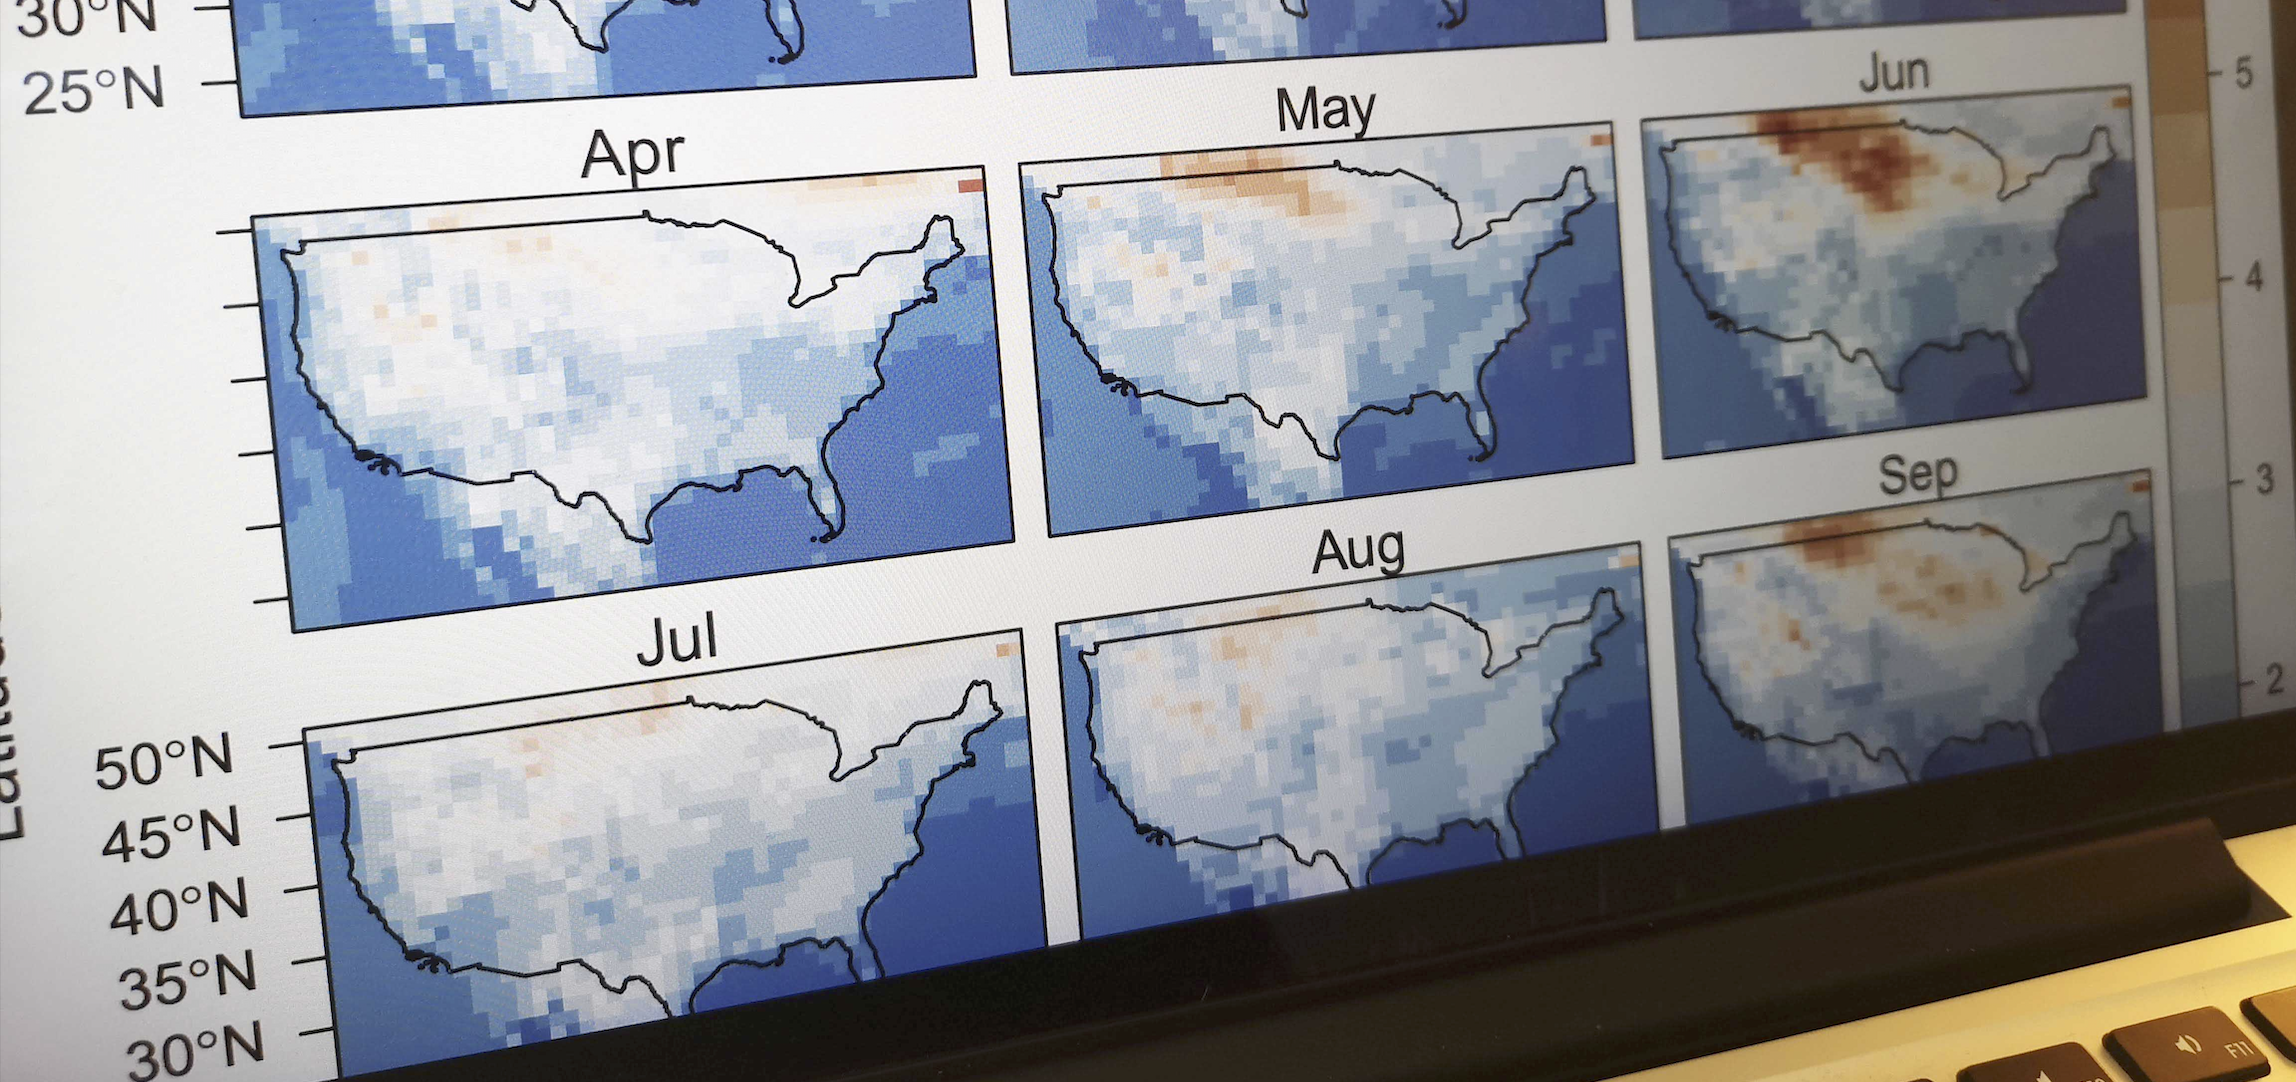
This project develops a web interface to communicate and visualize the uncertainty of climate change
forecasts and impacts on the economy. This tool will disseminate a great deal of data with a high
degree of spatial resolution, in an interactive, informative and visually compelling way. This wealth of
data cannot be typically published in peer-reviewed articles due to space limitations and it never
reaches other scientists, policymakers and the publicat large. For example, it is now possible to
estimate probability density functions of climate change impacts on the economy at the county level,
for different scenarios of emissions, over different time horizons. These probability density functions
allow displaying the full range of potential impacts, including rare outcomes. Unfortunately, it is hard
to imagine how to display thousands of graphs or tables – one for each county of the USA – using
traditional methods. The application that will be developed will make it easy to quickly access large
datasets on future climate change projections and economic impacts, using interactive maps, tables
and animations.
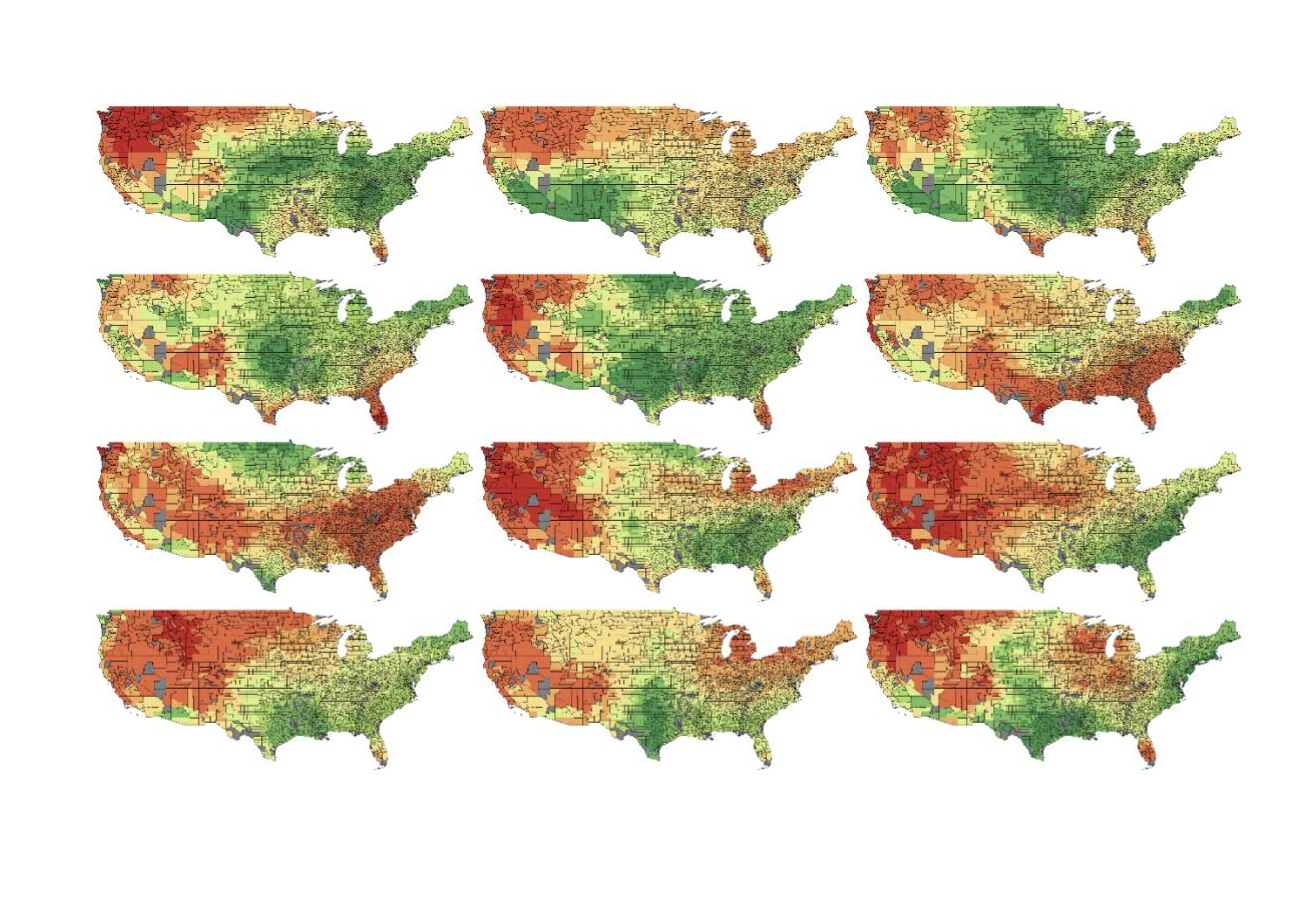
Impact of climate change on US agriculture in 2055 – high emissions scenario – different
climate models.
Emanuele Massetti. “Chaos in Climate Change Impacts Estimates” presented at the Southern Economics Association meeting in November 2019 and (remotely) at the European Geological Union Assembly in April 2020.